miRmap algorithm
Features
| Category | Feature | Description |
|---|---|---|
| Thermodynamic | ΔG duplex | Minimum Free Energy (MFE) with RNAcofold |
| ΔG binding | Binding energy based on ensemble free energy | |
| ΔG seed duplex | Minimum Free Energy (MFE) of the seed with RNAcofold | |
| ΔG seed binding | Binding energy of the seed based on ensemble free energy | |
| ΔG open | mRNA opening free energy - Accessibility | |
| ΔG total | ΔG duplex + ΔG open | |
| Probabilistic | P.over binomial | Site over-representation probability (binomial distribution) |
| P.over exact | Site over-representation probability (exact distribution) | |
| Conservation | BLS | Branch Length Score on 3’-UTR fitted tree |
| PhyloP | SPH test from PhyloP | |
| Sequence | AU content | AU nucleotides composition around the seed |
| UTR position | Distance from the nearest 3’-UTR end | |
| 3’ pairing | 3’ compensatory pairing |
The free energies are computed with the Vienna RNA package. PhyloP is part of the PHAST library. The P.over exact feature is computed with the Spatt library.
Model
Features were combined with a linear model. The linear regression parameters were calculated on Grimson et al. dataset.
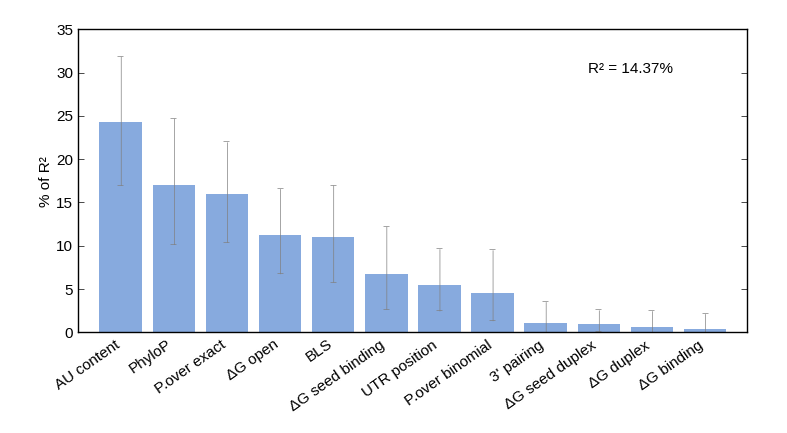
The miRmap model explains about 14% of variance of the experimental dataset. The histogram above shows the contribution of each feature.
Tutorials
Browse miRmap predictions
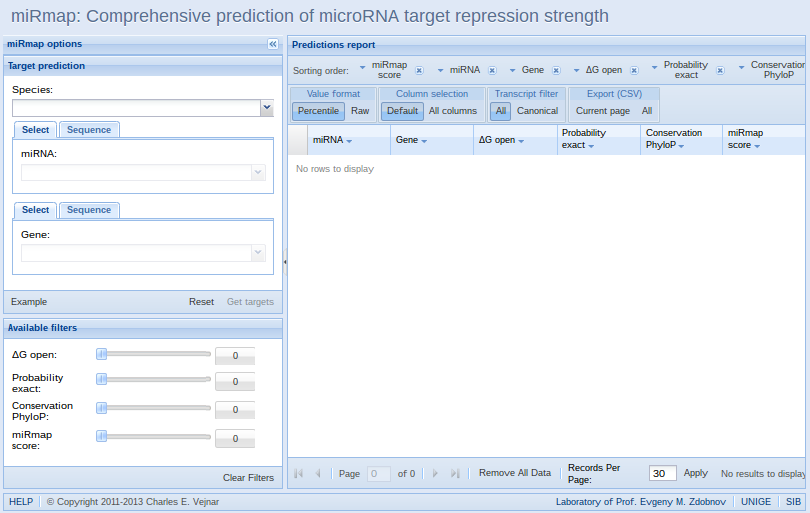 1. The miRmap web application has searching, sorting, filtering, and exporting features integrated in a single interface. To quickly test the interface, you can press the "Example" button that will submit a valid query for you.
In the next steps, a short description of each miRmap web functionality will be followed an example.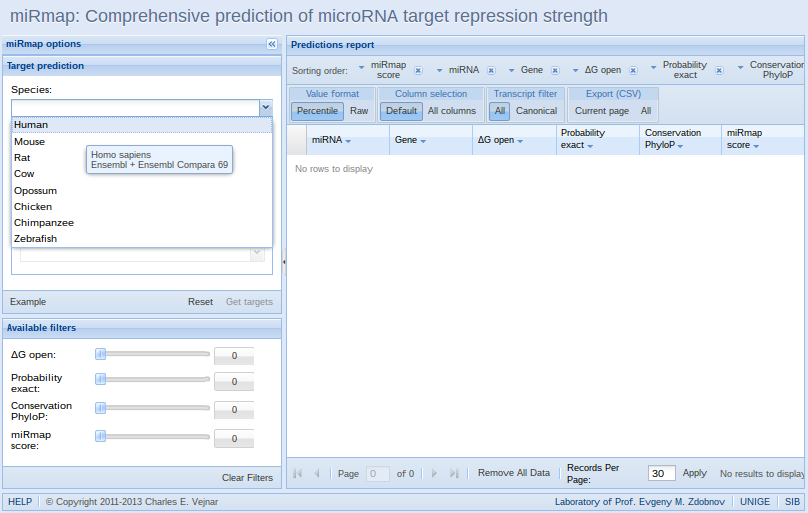 2. Start by selecting a species (multiple prediction sets can be available for a species; for example older sets). As for the mirna and gene selection fields (see after), you can input some text in the field to search among the available prediction sets, and select one in the search results.
In this example, we are selecting "Human".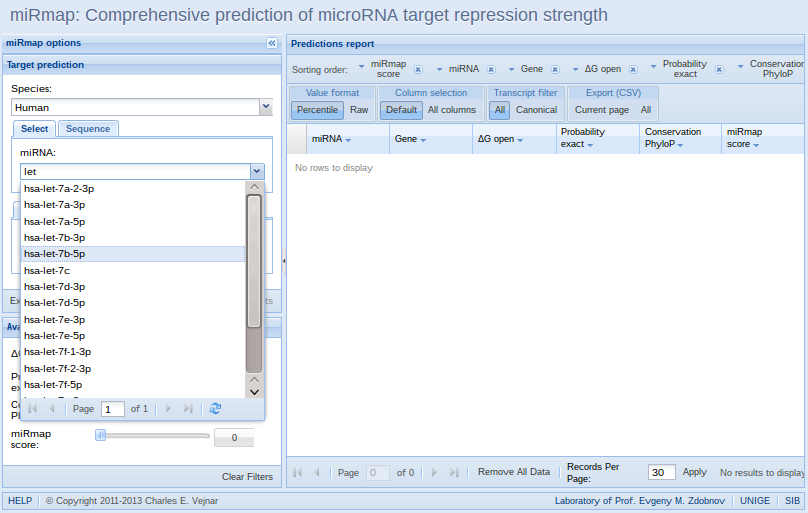 3. Search/select a mirna and/or a gene: selecting both a mirna and a gene is not required.
In this example, we search for "let", and select the Human miRNA "hsa-let7b-5p".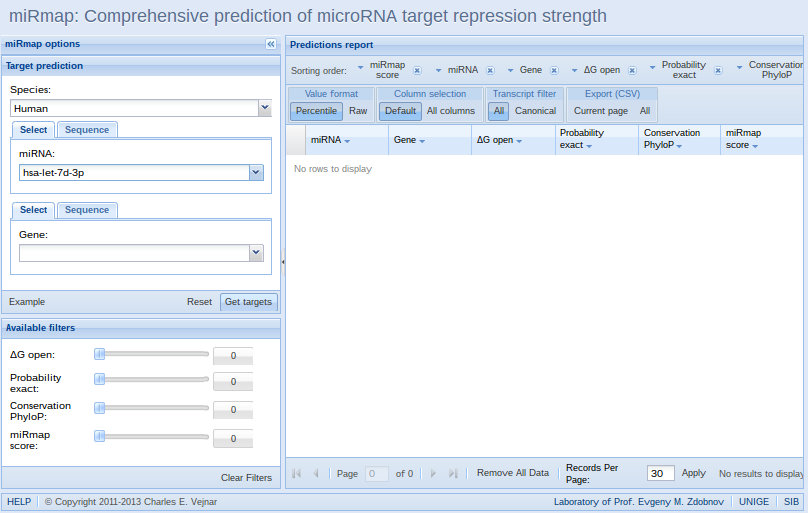 4. Submit the form to get all predicted targets and their ranking evaluated by miRmap by clicking on the "Get targets" button.
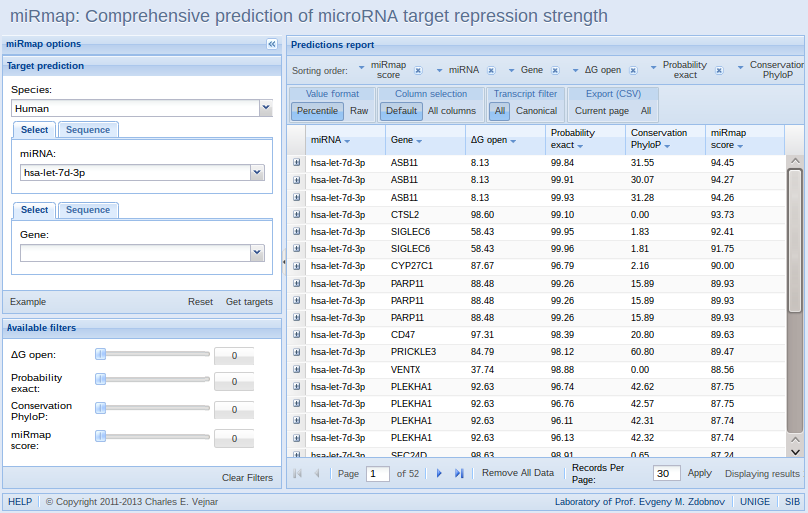 5. The results of the query is displayed inside the table on the right part of the interface. Default options are applied and can be changed in the toolbars on top of the results table.
- Sorting is applied according to the buttons in the toolbar from left to right,
- Default format of prediction values: predicted miRNA repression strength are displayed as "Percentile" (from 0 to 100%, with 100% being the greatest repression) in the "Value format" section of the second toolbar.
- A selection of most relevant features is displayed by default. To display all features, select the "All columns" button (individual column selection is shown after).
- All alternative transcripts for a gene are displayed by default: to display only canonical transcripts, click on the "Canonical" button in the "Transcript filter" section.
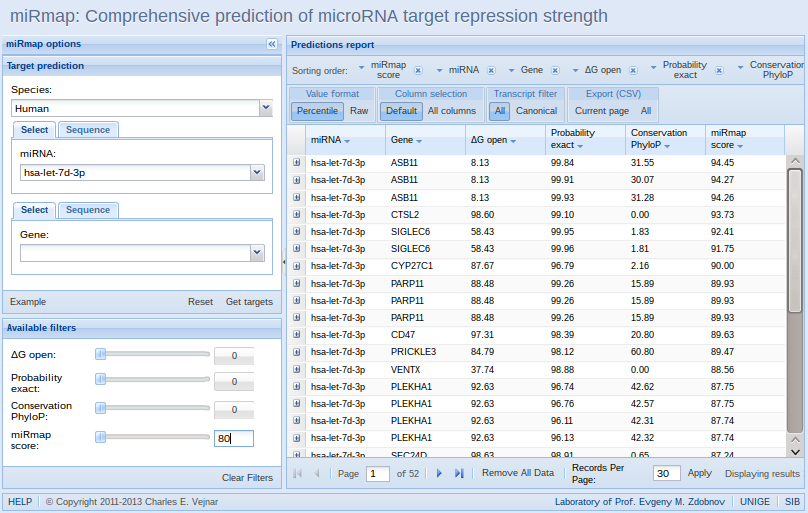 6. You can filter the targets by applying a filter on a miRmap feature or the miRmap score.
In this example, we click on the "0", the miRmap score current threshold, and enter "80". It is also possible to assign a threshold to a filter by moving its slider.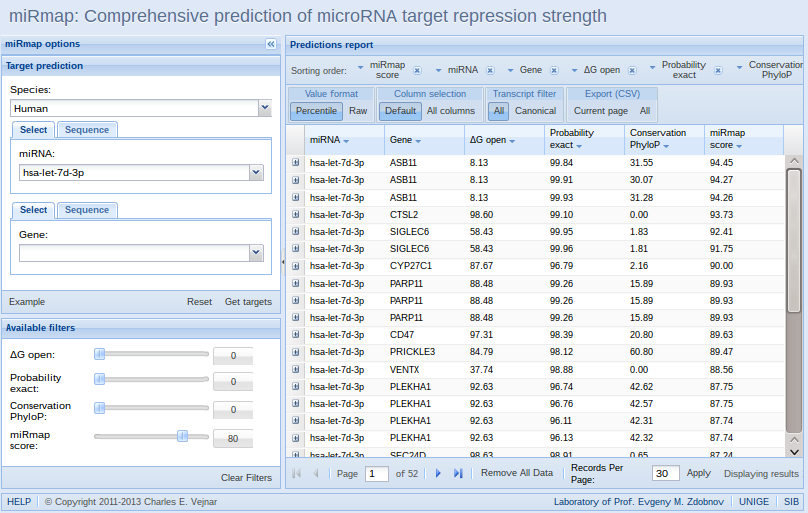 7. After validation, the new threshold is applied: the filtered targets are displayed in the results table.
In this example, only targets with a miRmap score higher than 80 are displayed.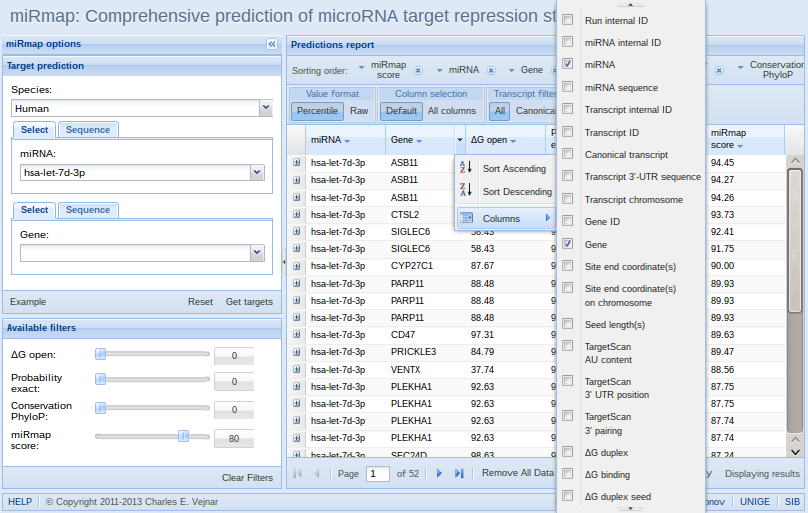 8. In the results table, a subset of feature are displayed by default. By clicking on the right side of each column, selected features will be displayed.
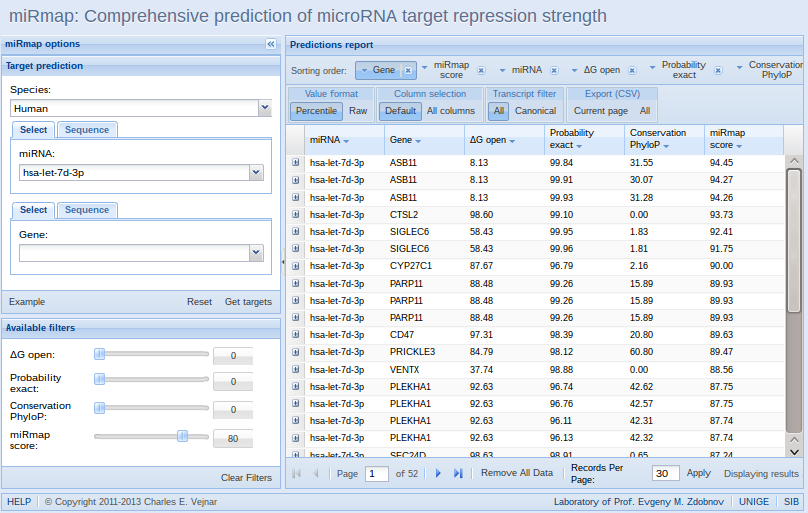 9. On top of the results table, sorting of the results table is defined from left to right. To reverse the sorting, click on a feature button.
In this example, we drag and drop the "Gene" button to sort by gene name.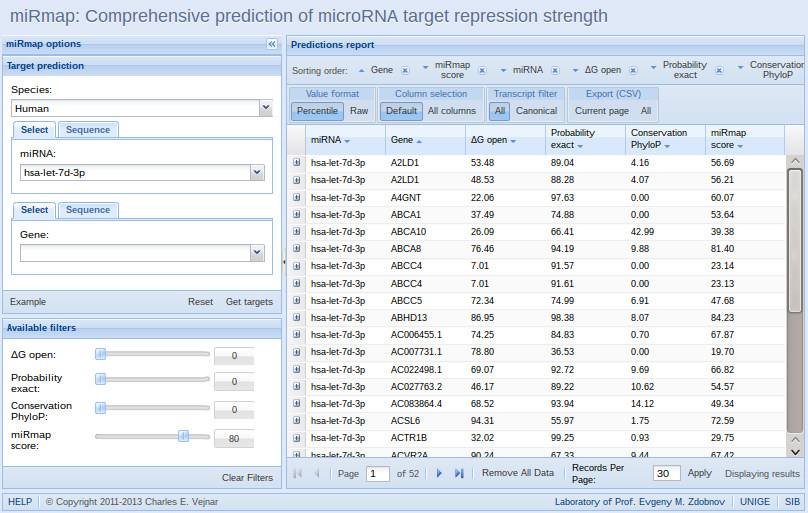 10. After dropping the "Gene" button the sorting toolbar, the results are re-ordered by gene first.
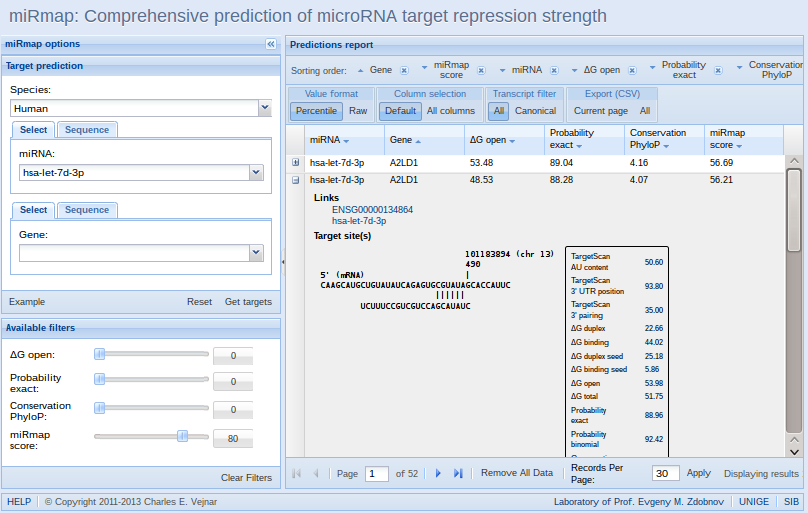 11. Each miRNA-mRNA pair has a single line in the results table. However, a miRNA can have multiple target sites on a single mRNA. By clicking on the expand icon on a line in the results table (left), details about each target site is shown.
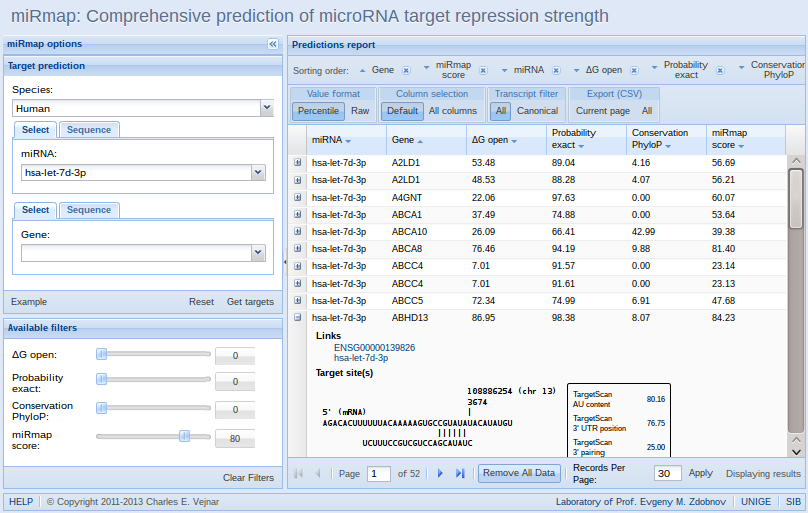 12. By clicking on the "Remove All Data" button, all results will be erased, and you can start with a new empty results table.
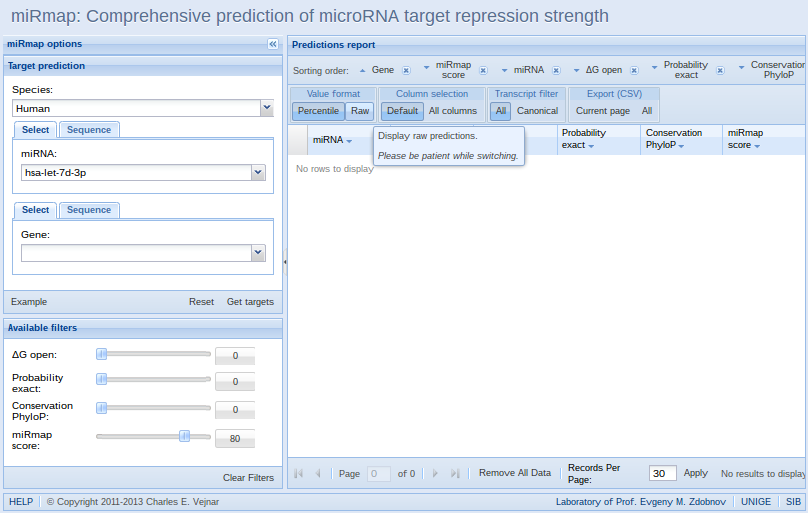 13. By default, results are displayed as percentiles. To switch to raw values, click on the "Raw" button in the toolbar of the results table.
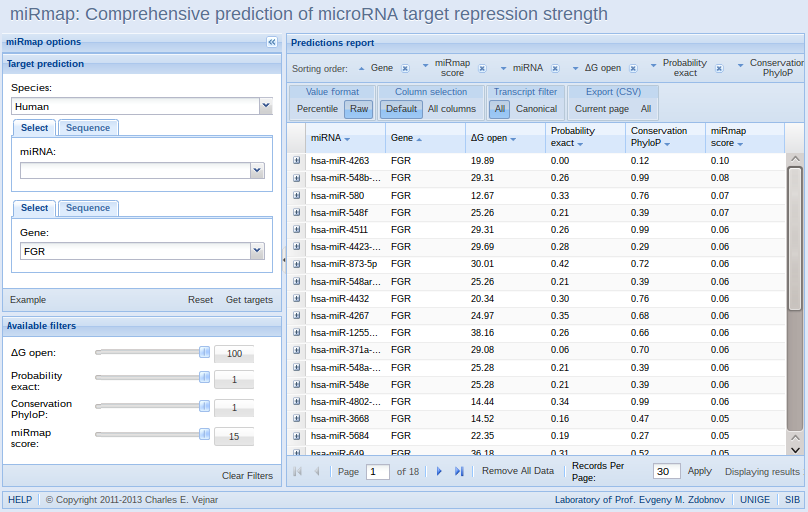 14. In this example, we removed the selected miRNA, selected the gene "FGR", and obtained predictions as raw values in the results table. As we changed from percentiles to raw values, filters were reset.
Predict your own targets
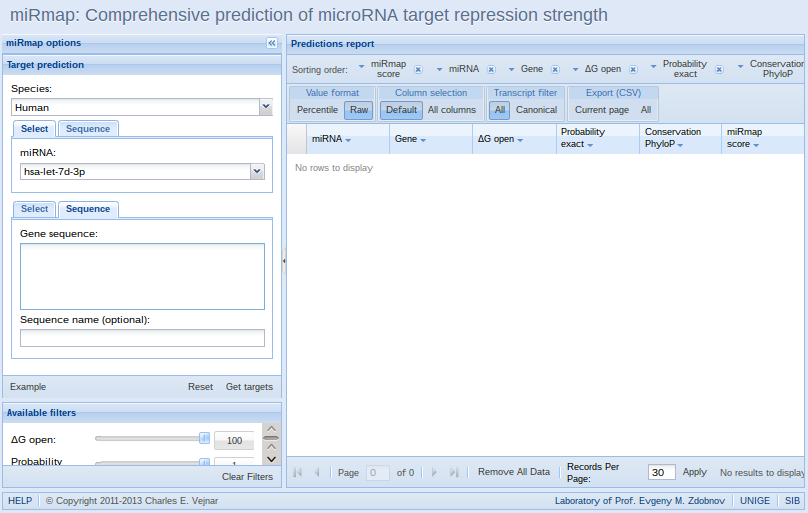 1. The miRmap web application can predict targets on user-submitted sequences, by selecting the "Sequence" tab for the miRNA and/or the gene. When used on a single sequence, miRmap returns raw values: we selected "Raw" as Value format (please note that for your convenience the filters maximum and minimum were calibrated on pre-computed predictions).
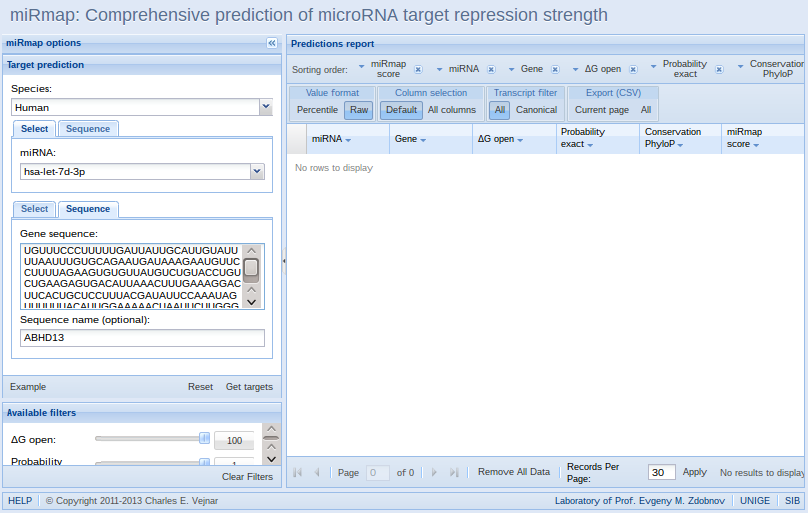 2. Inside the text area "Gene sequence", the user can input his/her sequence. If the user-submitted sequence contains invalid letters (non-nucleotide letters, new lines...), they will be automatically removed.
In this example, we copy-pasted the 3'-UTR sequence of the ABHD13 gene.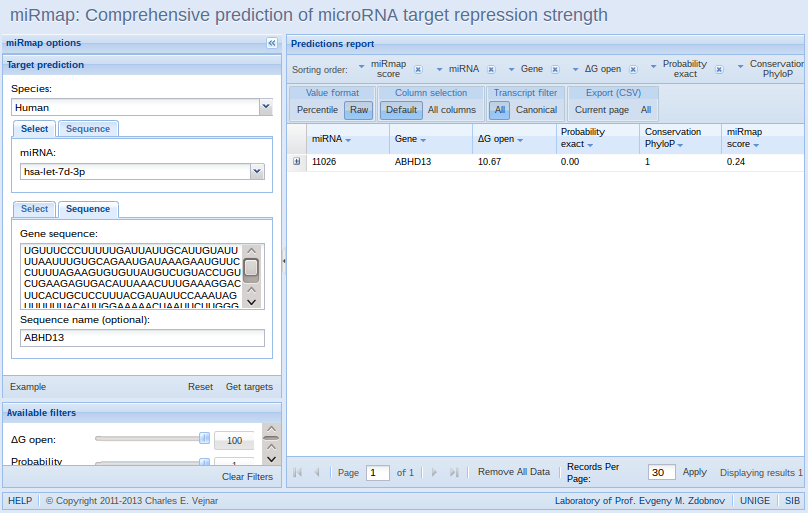 3. miRmap will compute and return predictions after clicking the "Get targets" button.
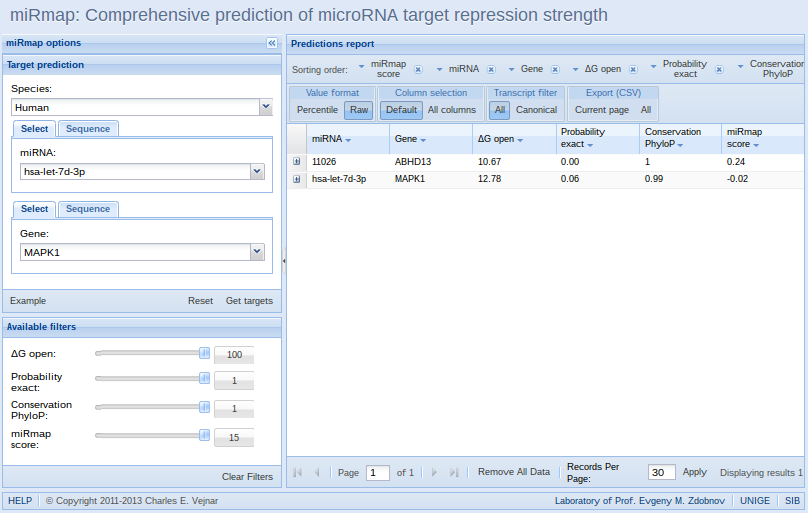 4. It is possible to compare predictions on user-submitted sequences with pre-computed predictions.
In this example, we search, select, and get targets for the MAPK1 gene.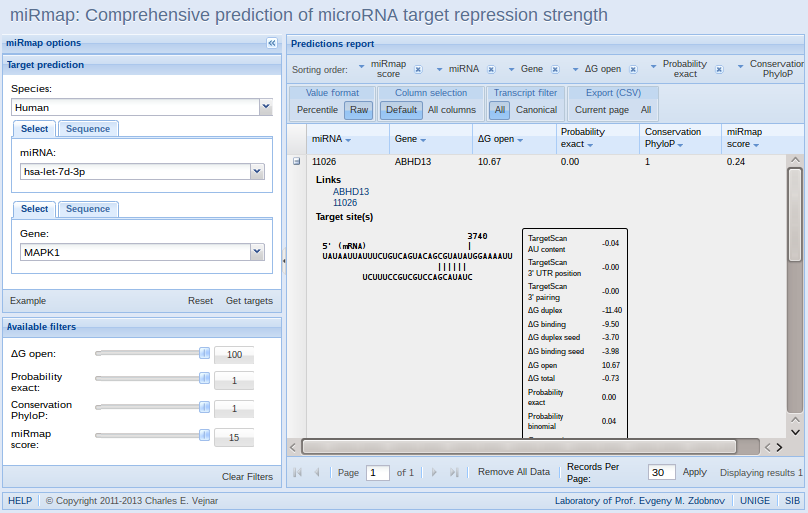 5. Each miRNA-mRNA pair has a single line in the results table. However, a miRNA can have multiple target sites on a single mRNA. By clicking on the expand icon on a line in the results table (left), details about each target site is shown for our own sequence.
